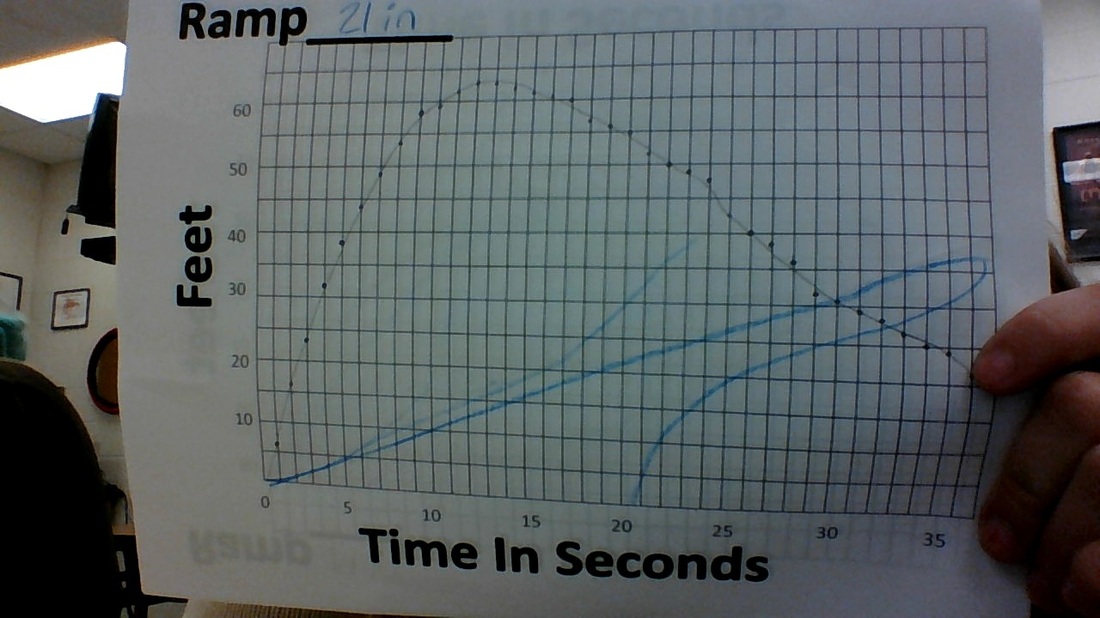
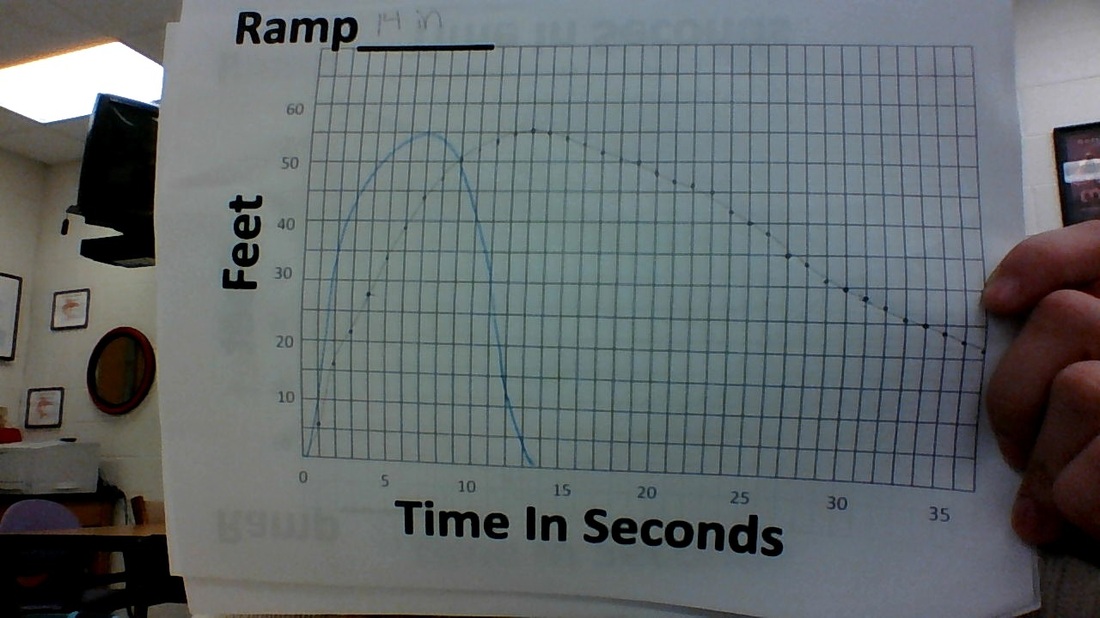
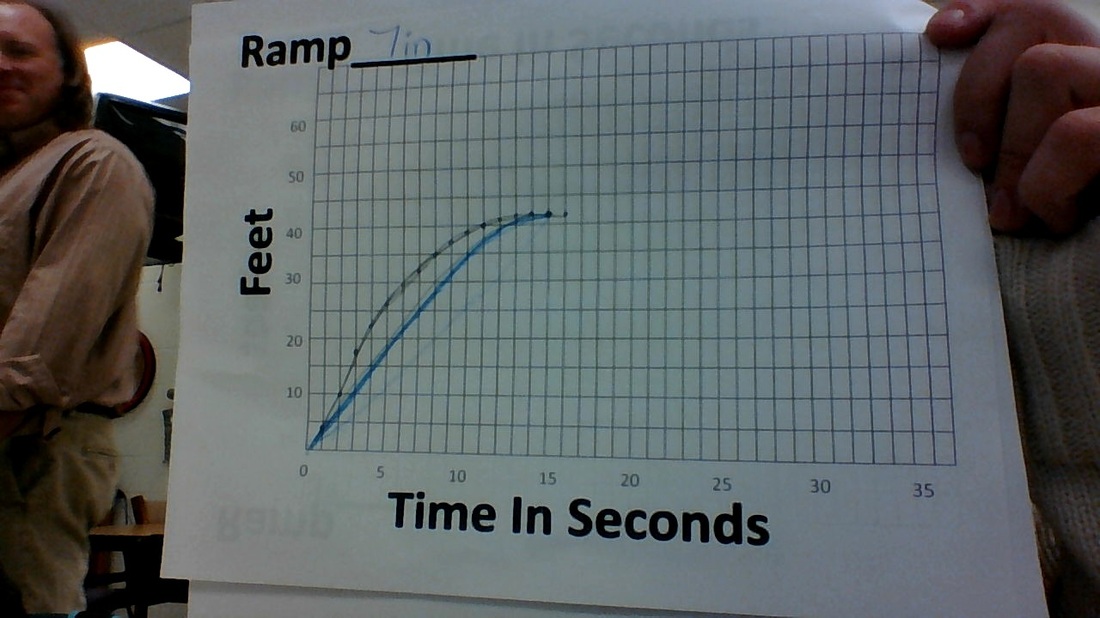
The graphs above show my predictions (blue) of what the graph would look like when a skateboard was let go on a driveway from 21 in, 14 in, and 7 in high ramps. My predictions for the 21 in and 14 in ramps were off dramatically. My prediction for the 14 in ramp to the actual graph had similar maximums, but I didn't pay attention to how long the skateboard rolled and therefore I cut the graph off too short. For the 21 inch ramp the domain was [0, 37] and the range is [0, 64]. For the 14 inch ramp the domain was [0, 37] and the range is [0, 55]. For the 7 inch ramp the domain was [0, 16] and the range was [0, 42]. Each graph has a minimum of 0, but also has a different maximum depending on how high the ramp was. The maximum for the 21 inch ramp was the highest, and as the height of the ramp decreased so did the maximum of the graph. The skateboard has the most speed when the ramp is higher and less speed when the ramp is lower. When the skateboard reaches its maximum on the driveway, its speed begins to decrease and the skateboard then rolls backwards. The skateboard has the most speed when the slope of the graph is steeper, because there was close to no friction causing the skateboard to slow down.
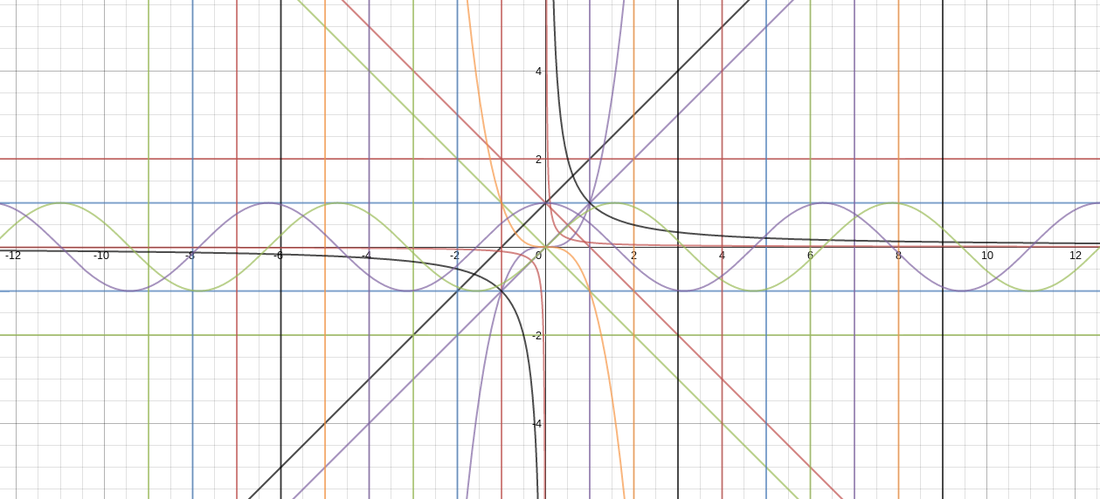
By using Desmos Online Graphing Calculator, I was able to create this piece of art using only math functions. I really enjoyed plugging in different functions to see what kind of lines and shapes they made; my favorite functions are the Sine and Cosine Functions. I used a lot of Vertical and Horizontal Line Functions because I couldn't really figure out how to cover the graph with any of the other functions. Also, I used the Quadratic Function, Identity Function and the Reciprocal Function. If I were to do this project over, I would use more Reciprocal and Identity Functions.
|
AuthorWrite something about yourself. No need to be fancy, just an overview. Archives
April 2015
Categories |
 RSS Feed
